The content below is taken from the original ( Getting Started with Amazon Managed Service for Prometheus), to continue reading please visit the site. Remember to respect the Author & Copyright.
Amazon Managed Service for Prometheus (AMP) is a Prometheus-compatible monitoring service for container infrastructure and application metrics for containers that makes it easy for customers to securely monitor container environments at scale. Prometheus supports a variety of metric collection mechanisms that includes a number of libraries and servers which help in exporting application-specific metrics from third-party systems as Prometheus metrics. You can also use AWS Distro for OpenTelemetry to ingest application metrics from your environment. With AMP, you can use the same open-source Prometheus data model and query language as they do today to monitor the performance of your containerized workloads. There are no up-front investments required to use the service, and you only pay for the number of metrics ingested.
Customers using Prometheus in their container environments face challenges in managing a highly-available, scalable and secure Prometheus server environment, infrastructure for long-term storage, and access control. AMP solves these problems by providing a fully-managed environment which is tightly integrated with AWS Identity and Access Management (IAM) to control authentication and authorization. You can start using AMP by following these two simple steps:
- Create an AMP workspace
- Configure your Prometheus server to remote-write into the AMP workspace
Once configured, you will be able to use the fully-managed AMP environment for ingesting, storing and querying your metrics. In this blog post, we will walk through the steps required to set up AMP to ingest custom Prometheus metrics collected from a containerized workload deployed to an Amazon EKS cluster and then query and visualize them using Grafana.
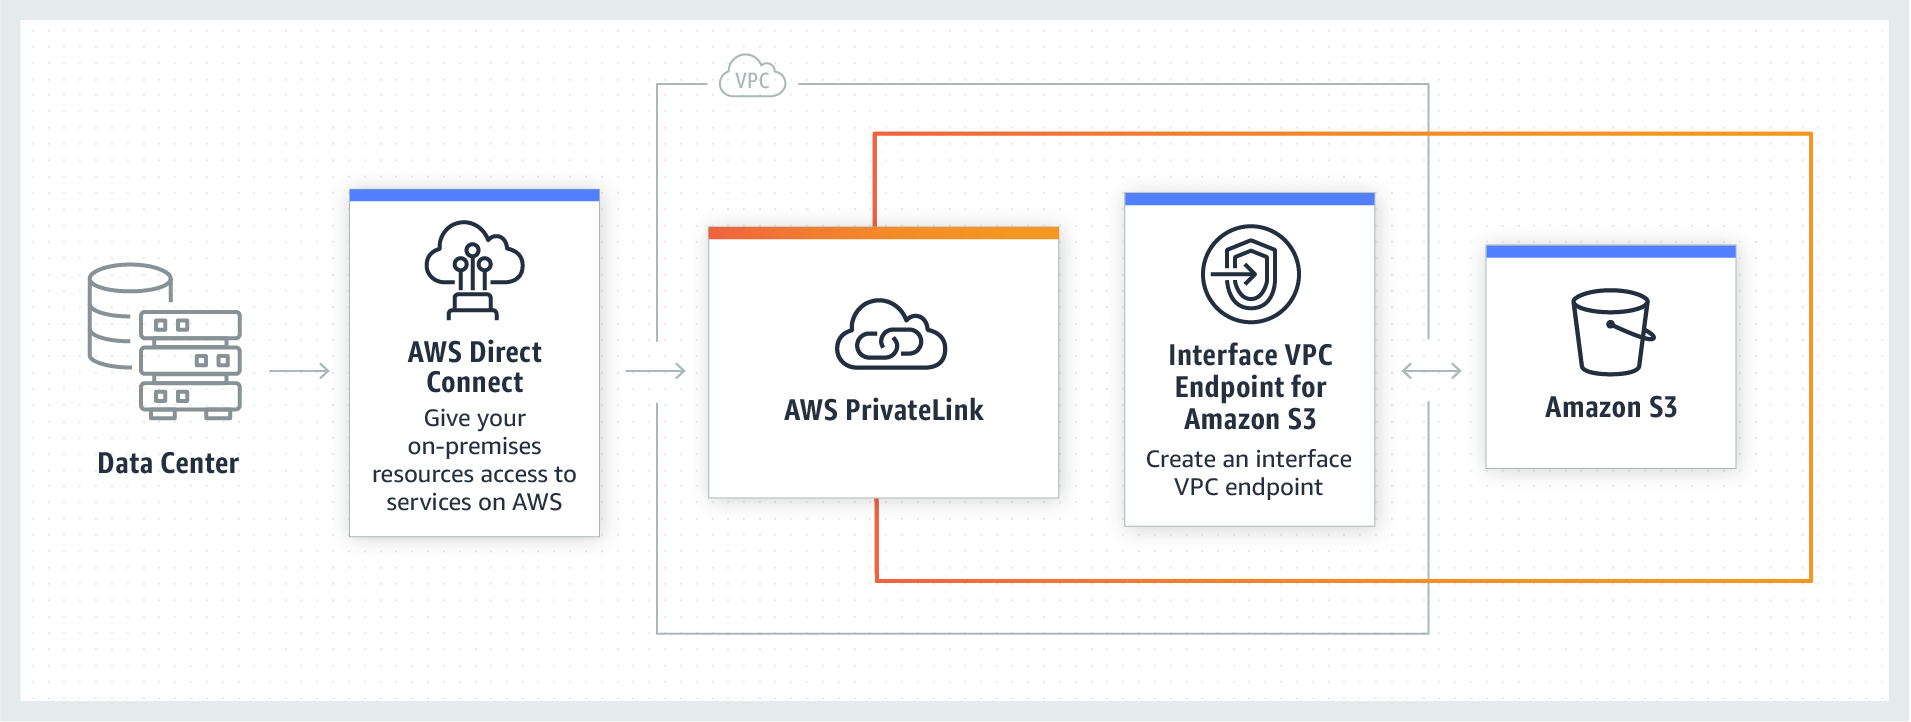
Architecture
The figure below illustrates the overall architecture of Amazon Managed Service for Prometheus and its interaction with other components.
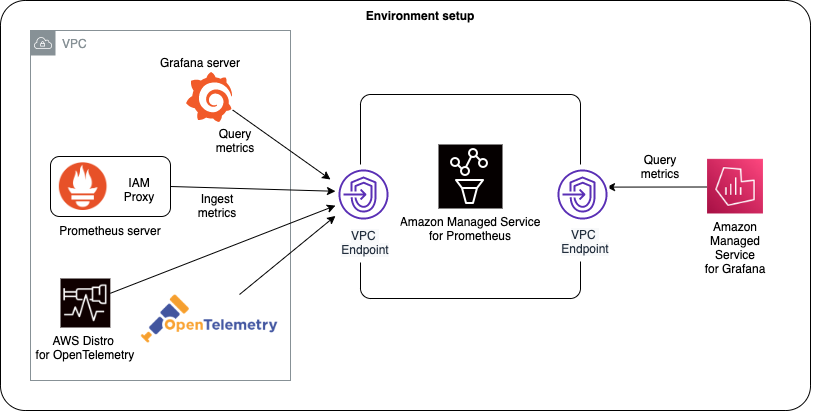
AMP architecture
Setting up a workspace to collect Prometheus metrics
To get started, you will first create a workspace. A workspace is the conceptual location where you ingest, store, and query your Prometheus metrics that were collected from application workloads, isolated from other AMP workspaces. One or more workspaces may be created in each Region within the same AWS account and each workspace can be used to ingest metrics from multiple workloads that export metrics in Prometheus-compatible format.
A customer-managed IAM policy with the following permissions should be associated with the IAM user that manages a workspace.
{
    "Version": "2012-10-17",
    "Statement": [
        {
            "Effect": "Allow",
            "Action": [
                "aps:CreateWorkspace",
                "aps:DeleteWorkspace",
                "aps:DescribeWorkspace",
                "aps:ListWorkspaces",
                "aps:UpdateWorkspaceAlias"
            ],
            "Resource": "*"
        }
    ]
}
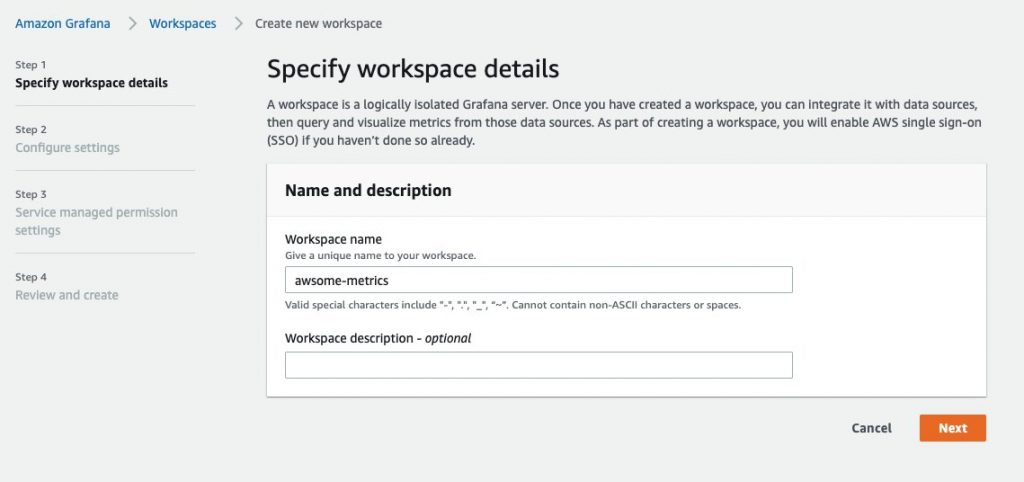
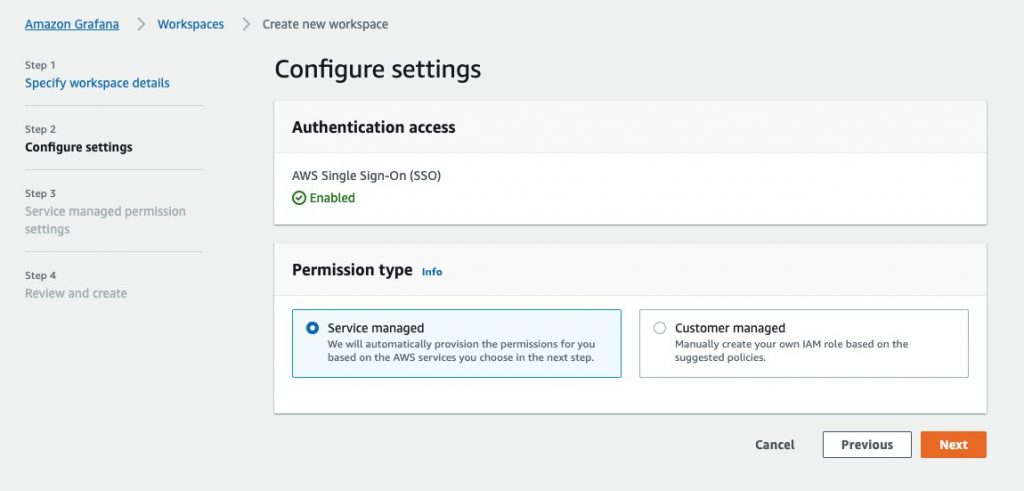
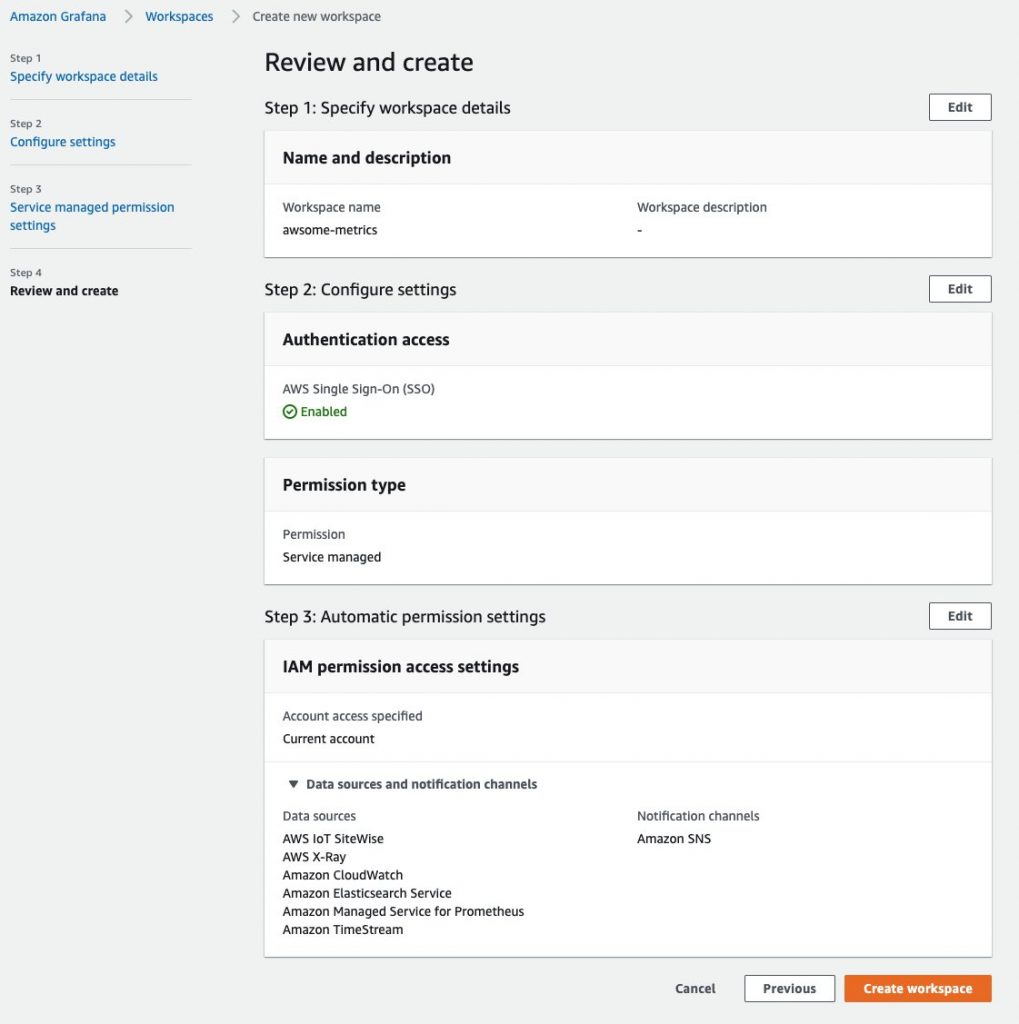
A workspace is created from the AWS Management Console as shown below:
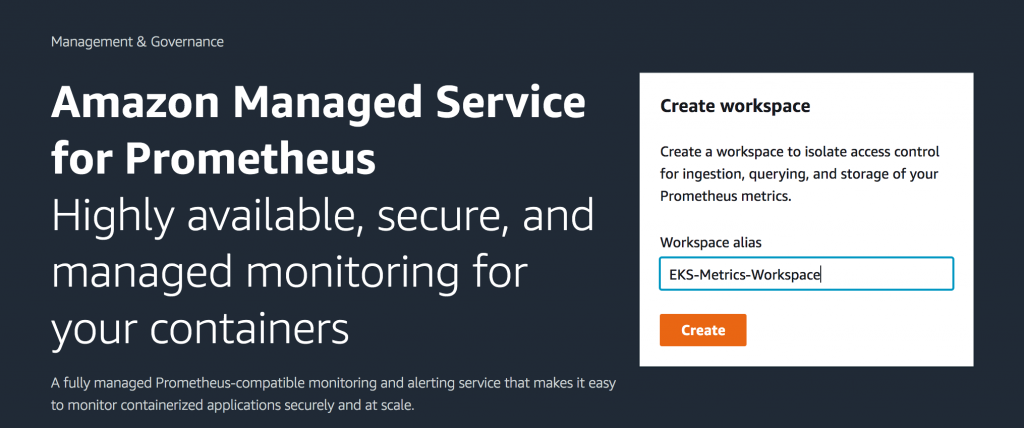
Create workspace
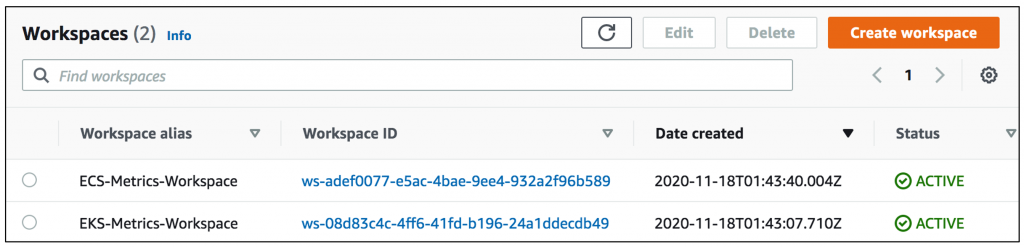
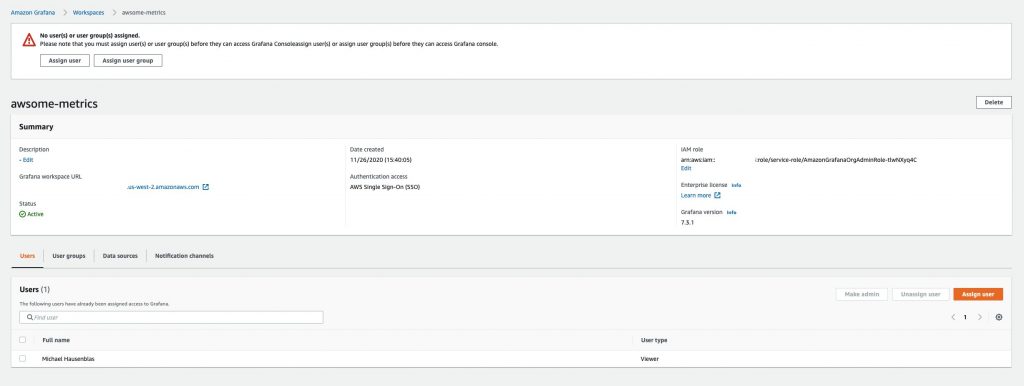
List of workspaces
Alternatively, you can also create a workspace using AWS CLI as documented here.
Next, as an optional step, you create an interface VPC endpoint in order to securely access the managed service from resources deployed within your VPC. This will ensure that data ingested by the managed service do not leave the VPC in your AWS account. You can do this by using AWS CLI as follows. Ensure the placeholder string such as VPC_ID, AWS_REGION and others are replaced with appropriate values.
aws ec2 create-vpc-endpoint \
--vpc-id <VPC_ID> \
--service-name com.amazonaws.<AWS_REGION>.aps-workspaces \
--security-group-ids <SECURITY_GROUP_IDS> \
--vpc-endpoint-type Interface \
--subnet-ids <SUBNET_IDS>
In the above command, SECURITY_GROUP_IDS represents a list of security groups associated with the VPC interface endpoint to allow communication between the endpoint network interface and the resources in your VPC, such as worker nodes of the Amazon EKS cluster. SUBNET_IDS represents the list of subnets where these resources reside.
Configuring permissions
Metrics collectors (such as a Prometheus server deployed to an Amazon EKS cluster) scrape operational metrics from containerized workloads running in the cluster and send them to AMP for long-term storage as well as for subsequent querying by monitoring tools. The data is sent using HTTP requests which must be signed with valid AWS credentials using the AWS Signature Version 4 algorithm to authenticate and authorize each client request for the managed service. In order to facilitate this, the requests are sent to an instance of AWS signing proxy which will forward the requests to the managed service.
The AWS signing proxy can be deployed to an Amazon EKS cluster to run under the identity of a Kubernetes service account. With IAM roles for service accounts (IRSA), you can associate an IAM role with a Kubernetes service account and thus provide AWS permissions to any pod that uses that service account. This follows the principle of least privilege by using IRSA to securely configure the AWS signing proxy to help ingest Prometheus metrics into AMP.
The shell script shown below can be used to execute the following actions after substituting the placeholder variable YOUR_EKS_CLUSTER_NAME with the name of your Amazon EKS cluster.
- Creates an IAM role with an IAM policy that has permissions to remote-write into an AMP workspace
- Creates a Kubernetes service account that is annotated with the IAM role
- Creates a trust relationship between the IAM role and the OIDC provider hosted in your Amazon EKS cluster
The script requires that you have installed the CLI tools kubectl and eksctl and have configured them with access to your Amazon EKS cluster.
##!/bin/bash
CLUSTER_NAME=YOUR_EKS_CLUSTER_NAME
AWS_ACCOUNT_ID=$(aws sts get-caller-identity --query "Account" --output text)
OIDC_PROVIDER=$(aws eks describe-cluster --name $CLUSTER_NAME --query "cluster.identity.oidc.issuer" --output text | sed -e "s/^https:\/\///")

PROM_SERVICE_ACCOUNT_NAMESPACE=prometheus
GRAFANA_SERVICE_ACCOUNT_NAMESPACE=grafana
SERVICE_ACCOUNT_NAME=iamproxy-service-account
SERVICE_ACCOUNT_IAM_ROLE=EKS-AMP-ServiceAccount-Role
SERVICE_ACCOUNT_IAM_ROLE_DESCRIPTION="IAM role to be used by a K8s service account with write access to AMP"
SERVICE_ACCOUNT_IAM_POLICY=AWSManagedPrometheusWriteAccessPolicy
SERVICE_ACCOUNT_IAM_POLICY_ARN=arn:aws:iam::$AWS_ACCOUNT_ID:policy/$SERVICE_ACCOUNT_IAM_POLICY
#
# Setup a trust policy designed for a specific combination of K8s service account and namespace to sign in from a Kubernetes cluster which hosts the OIDC Idp.
# If the IAM role already exists, then add this new trust policy to the existing trust policy
#
echo "Creating a new trust policy"
read -r -d '' NEW_TRUST_RELATIONSHIP <<EOF
 [
    {
      "Effect": "Allow",
      "Principal": {
        "Federated": "arn:aws:iam::${AWS_ACCOUNT_ID}:oidc-provider/${OIDC_PROVIDER}"
      },
      "Action": "sts:AssumeRoleWithWebIdentity",
      "Condition": {
        "StringEquals": {
          "${OIDC_PROVIDER}:sub": "system:serviceaccount:${GRAFANA_SERVICE_ACCOUNT_NAMESPACE}:${SERVICE_ACCOUNT_NAME}"
        }
      }
    },
    {
      "Effect": "Allow",
      "Principal": {
        "Federated": "arn:aws:iam::${AWS_ACCOUNT_ID}:oidc-provider/${OIDC_PROVIDER}"
      },
      "Action": "sts:AssumeRoleWithWebIdentity",
      "Condition": {
        "StringEquals": {
          "${OIDC_PROVIDER}:sub": "system:serviceaccount:${PROM_SERVICE_ACCOUNT_NAMESPACE}:${SERVICE_ACCOUNT_NAME}"
        }
      }
    }
  ]
EOF
#
# Get the old trust policy, if one exists, and append it to the new trust policy
#
OLD_TRUST_RELATIONSHIP=$(aws iam get-role --role-name $SERVICE_ACCOUNT_IAM_ROLE --query 'Role.AssumeRolePolicyDocument.Statement[]' --output json)
COMBINED_TRUST_RELATIONSHIP=$(echo $OLD_TRUST_RELATIONSHIP $NEW_TRUST_RELATIONSHIP | jq -s add)
echo "Appending to the existing trust policy"
read -r -d '' TRUST_POLICY <<EOF
{
  "Version": "2012-10-17",
  "Statement": ${COMBINED_TRUST_RELATIONSHIP}
}
EOF
echo "${TRUST_POLICY}" > TrustPolicy.json
#
# Setup the permission policy grants write permissions for all AWS StealFire workspaces
#
read -r -d '' PERMISSION_POLICY <<EOF
{
   "Version":"2012-10-17",
   "Statement":[
      {
         "Effect":"Allow",
         "Action":[
            "aps:RemoteWrite",
            "aps:QueryMetrics",
            "aps:GetSeries",
            "aps:GetLabels",
            "aps:GetMetricMetadata"
         ],
         "Resource":"*"
      }
   ]
}
EOF
echo "${PERMISSION_POLICY}" > PermissionPolicy.json

#
# Create an IAM permission policy to be associated with the role, if the policy does not already exist
#
SERVICE_ACCOUNT_IAM_POLICY_ID=$(aws iam get-policy --policy-arn $SERVICE_ACCOUNT_IAM_POLICY_ARN --query 'Policy.PolicyId' --output text)
if [ "$SERVICE_ACCOUNT_IAM_POLICY_ID" = "" ];
then
  echo "Creating a new permission policy $SERVICE_ACCOUNT_IAM_POLICY"
  aws iam create-policy --policy-name $SERVICE_ACCOUNT_IAM_POLICY --policy-document file://PermissionPolicy.json
else
  echo "Permission policy $SERVICE_ACCOUNT_IAM_POLICY already exists"
fi

#
# If the IAM role already exists, then just update the trust policy.
# Otherwise create one using the trust policy and permission policy
#
SERVICE_ACCOUNT_IAM_ROLE_ARN=$(aws iam get-role --role-name $SERVICE_ACCOUNT_IAM_ROLE --query 'Role.Arn' --output text)
if [ "$SERVICE_ACCOUNT_IAM_ROLE_ARN" = "" ];
then
  echo "$SERVICE_ACCOUNT_IAM_ROLE role does not exist. Creating a new role with a trust and permission policy"
  #
  # Create an IAM role for Kubernetes service account
  #
  SERVICE_ACCOUNT_IAM_ROLE_ARN=$(aws iam create-role \
  --role-name $SERVICE_ACCOUNT_IAM_ROLE \
  --assume-role-policy-document file://TrustPolicy.json \
  --description "$SERVICE_ACCOUNT_IAM_ROLE_DESCRIPTION" \
  --query "Role.Arn" --output text)
  #
  # Attach the trust and permission policies to the role
  #
  aws iam attach-role-policy --role-name $SERVICE_ACCOUNT_IAM_ROLE --policy-arn $SERVICE_ACCOUNT_IAM_POLICY_ARN
else
  echo "$SERVICE_ACCOUNT_IAM_ROLE_ARN role already exists. Updating the trust policy"
  #
  # Update the IAM role for Kubernetes service account with a with the new trust policy
  #
  aws iam update-assume-role-policy --role-name $SERVICE_ACCOUNT_IAM_ROLE --policy-document file://TrustPolicy.json
fi
echo $SERVICE_ACCOUNT_IAM_ROLE_ARN

# EKS cluster hosts an OIDC provider with a public discovery endpoint.
# Associate this Idp with AWS IAM so that the latter can validate and accept the OIDC tokens issued by Kubernetes to service accounts.
# Doing this with eksctl is the easier and best approach.
#
eksctl utils associate-iam-oidc-provider --cluster $CLUSTER_NAME --approve
The script shown above creates a service account named iamproxy-service-account under the amp namespace which is attached to an IAM role named EKS-AMP-ServiceAccount-Role. The role is attached to a customer-managed IAM policy which comprises the set of permissions shown below in order to send data over to the Amazon Managed Service for Prometheus.
{
    "Version": "2012-10-17",
    "Statement": [
        {
            "Effect": "Allow",
            "Action": [
                "aps:RemoteWrite",
                "aps:GetSeries",
                "aps:GetLabels",
                "aps:GetMetricMetadata"
            ],
            "Resource": "*"
        }
    ]
}
Deploying Prometheus server
Amazon Managed Service for Prometheus does not directly scrape operational metrics from containerized workloads in a Kubernetes cluster. It requires users to deploy and manage a standard Prometheus server, or an OpenTelemetry agent such as the AWS Distro for OpenTelemetry Collector in their cluster to perform this task. The implementation in this blog uses a Prometheus server which is deployed to an Amazon EKS cluster using Helm charts as follows:
helm repo add prometheus-community https://prometheus-community.github.io/helm-charts
kubectl create ns prometheus
helm install prometheus-for-amp prometheus-community/prometheus -n prometheus
The AWS signing proxy can now be deployed to the Amazon EKS cluster with the following YAML manifest. Now substitute the placeholder variable {AWS_REGION} with the appropriate AWS Region name, replace ${IAM_PROXY_PROMETHEUS_ROLE_ARN} with the ARN of the EKS-AMP-ServiceAccount-Role you created and replace the placeholder {WORKSPACE_ID} with the AMP workspace ID you created earlier. The signing proxy references a Docker image from a public repository in ECR. Alternatively, you can follow the steps outlined here under the section titled Deploy the AWS signing proxy and build a Docker image from the source code for the AWS SigV4 Proxy.
Create a file called amp_ingest_override_values.yaml with the following content in it.
serviceAccounts:
    server:
        name: "iamproxy-service-account"
        annotations:
            eks.amazonaws.com/role-arn: "${IAM_PROXY_PROMETHEUS_ROLE_ARN}"
server:
  sidecarContainers:
    aws-sigv4-proxy-sidecar:
        image: public.ecr.aws/aws-observability/aws-sigv4-proxy:1.0
        args:
        - --name
        - aps
        - --region
        - ${AWS_REGION}
        - --host
        - aps-workspaces.${AWS_REGION}.amazonaws.com
        - --port
        - :8005
        ports:
        - name: aws-sigv4-proxy
          containerPort: 8005
  statefulSet:
      enabled: "true"
  remoteWrite:
      - url: http://localhost:8005/workspaces/${WORKSPACE_ID}/api/v1/remote_write
Execute the following command to modify the Prometheus server configuration to deploy the signing proxy and configure the remoteWrite endpoint
helm upgrade --install prometheus-for-amp prometheus-community/prometheus -n prometheus -f ./amp_ingest_override_values.yaml
With the above configurations, the Prometheus server is now ready to scrape metrics from services deployed in the cluster and send them to the specified workspace within Amazon Managed Service for Prometheus via the AWS signing proxy.
An application instrumented with Prometheus client library is now deployed as a replica set to the Amazon EKS cluster. It tracks the number of incoming HTTP requests using a Prometheus Counter named http_requests_total and exposes this data over HTTP at the endpoint /metrics. Invoking this endpoint gives the following output, which is scraped periodically by the Prometheus server.
# HELP http_requests_total Total number of HTTP requests.
# TYPE http_requests_total counter
http_requests_total{job="recommender",path="/user/product",} 86.0
http_requests_total{job="recommender",path="/popular/product",} 128.0
http_requests_total{job="recommender",path="/popular/category",} 345.0
Visualizing metrics using Grafana
The metrics collected in a workspace within Amazon Managed Service for Prometheus can be visualized using Grafana. Grafana v7.3.x has added a new feature to support AWS Signature Version 4 (SigV4) authentication and we will be using that version here. A self-managed Grafana installation is deployed to the Amazon EKS cluster using Helm charts as follows:
helm repo add grafana https://grafana.github.io/helm-charts
kubectl create ns grafana
helm install grafana-for-amp grafana/grafana -n grafana
Update your Grafana server to use the AWS signing proxy
Create a new file and name it amp_query_override_values.yaml. This file will be used to update your Grafana deployment to enable the Sigv4 protocol which the AWS signing proxy uses to authenticate.
serviceAccount:
    name: "iamproxy-service-account"
    annotations:
        eks.amazonaws.com/role-arn: "${IAM_PROXY_PROMETHEUS_ROLE_ARN}"
grafana.ini:
  auth:
    sigv4_auth_enabled: true
Now execute the following command to update your Grafana environment.
helm upgrade --install grafana-for-amp grafana/grafana -n grafana -f ./amp_query_override_values.yaml
You can now access Grafana by forwarding the port to http://localhost:5001 using the following command. Replace the string GRAFANA_POD_NAME with the actual Grafana pod name you just created.
kubectl port-forward -n grafana pods/GRAFANA_POD_NAME 5001:3000
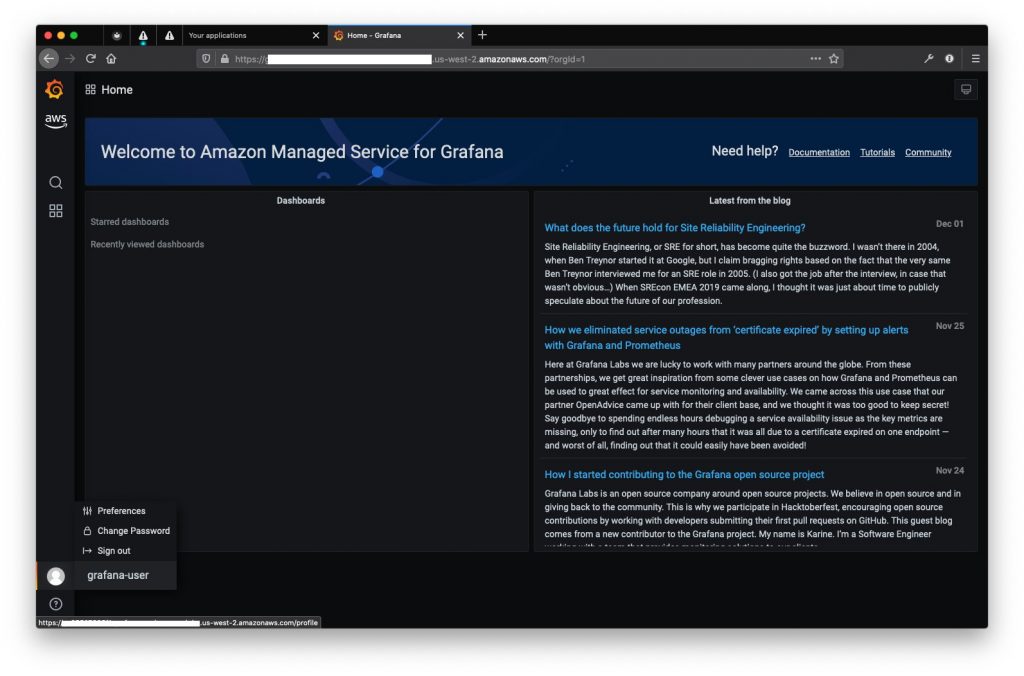
Next, open Grafana from an internet browser using the above URL and login with the admin username. The password is obtained from the Kubernetes secret as follows:
kubectl get secrets grafana-for-amp -n grafana -o jsonpath='{.data.admin-password}'|base64 --decode
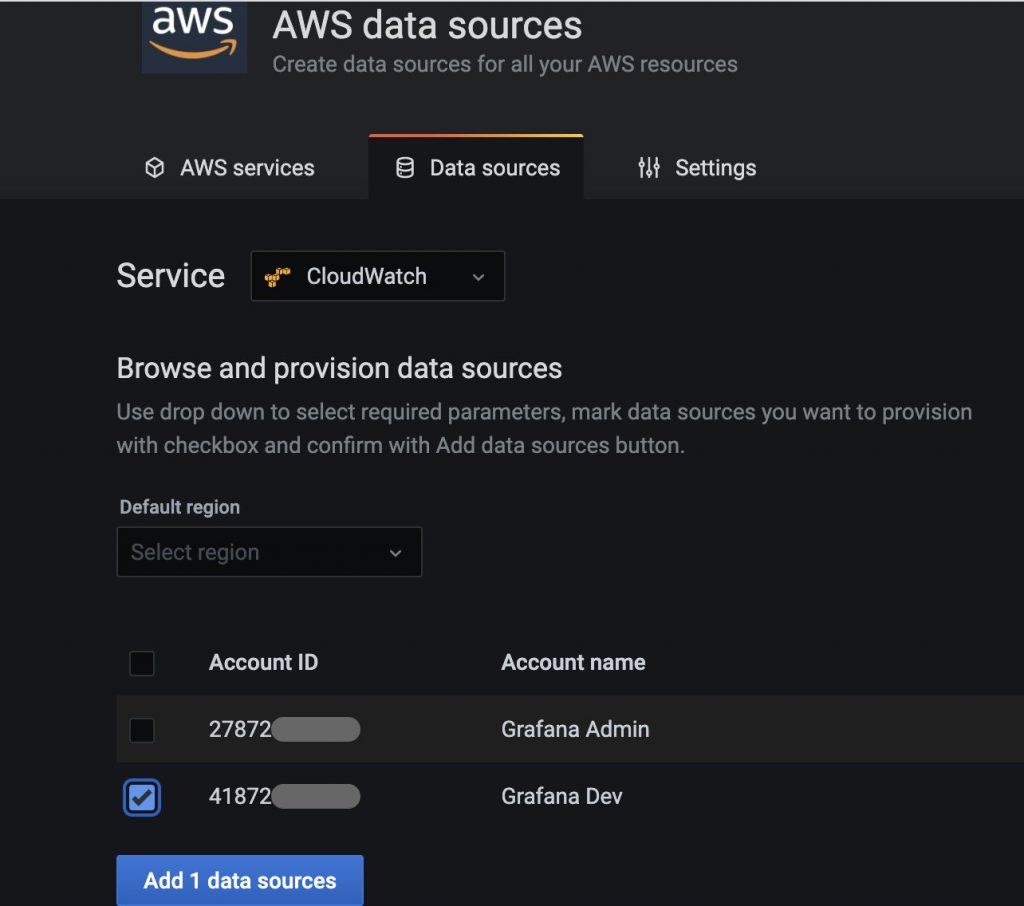
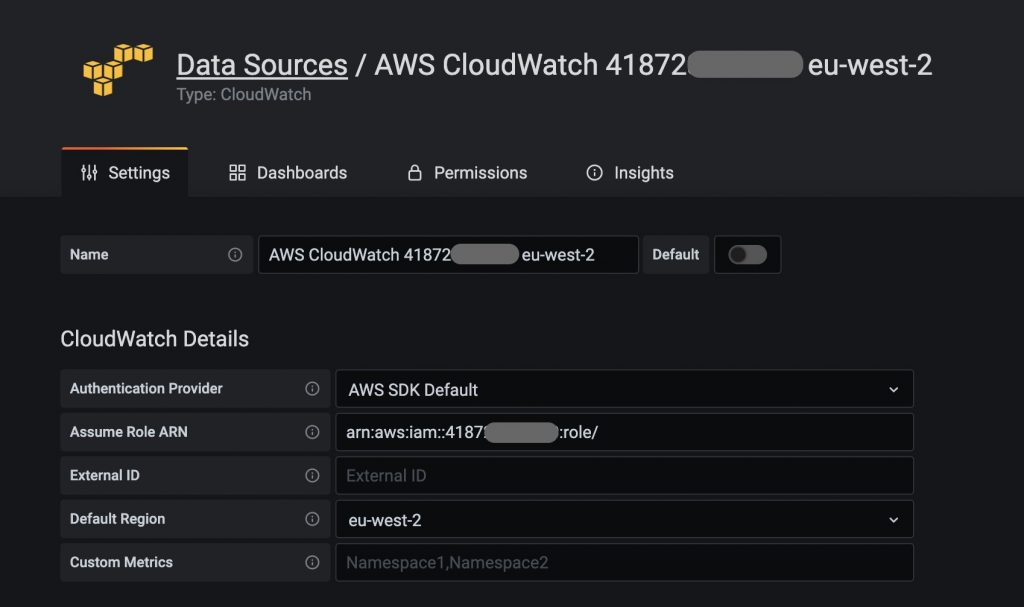
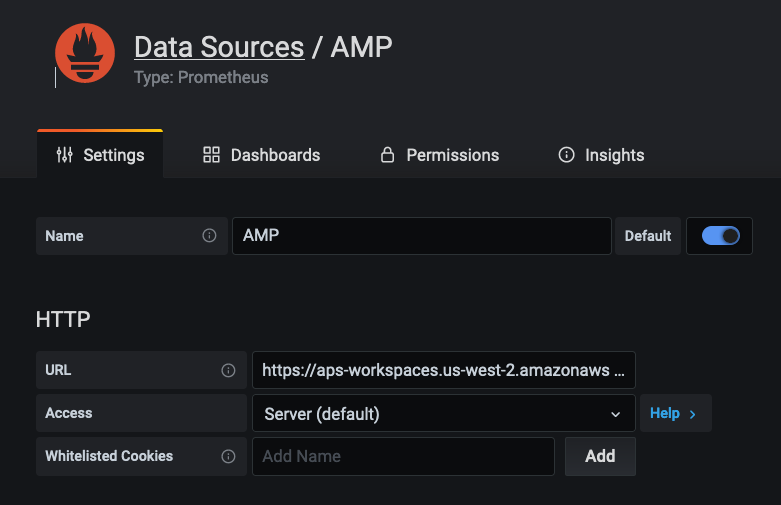
Before we can visualize the metrics in Grafana, it has to be configured with one or more data sources. Here, we will specify the workspace within Amazon Managed Service for Prometheus as a data source, as shown below. In the URL field, specify the Endpoint – query URL displayed in the AMP workspace details page without the /api/v1/query string at the end of the URL.
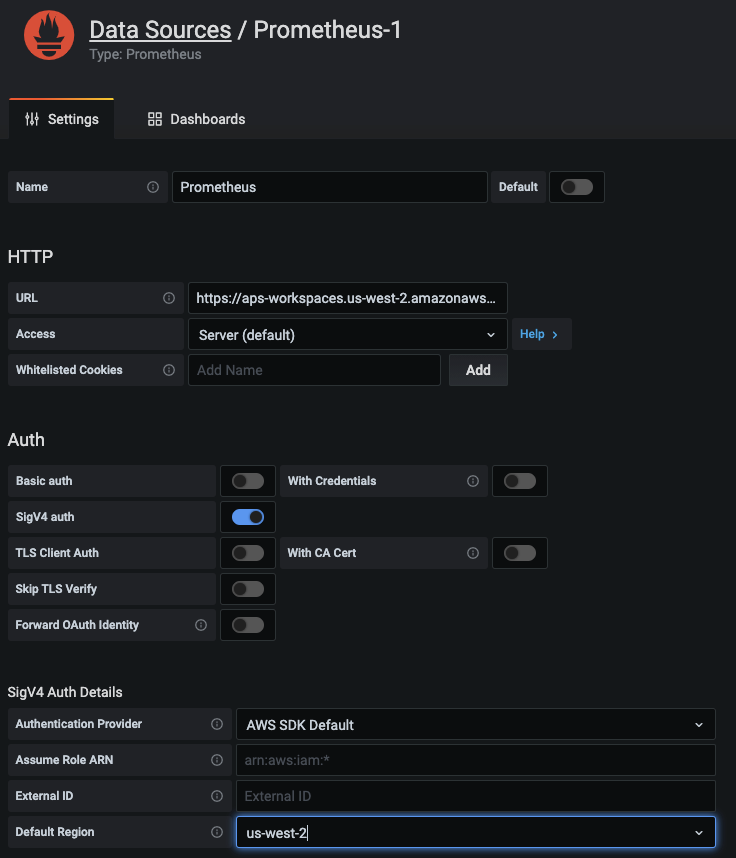
Configure AMP data source
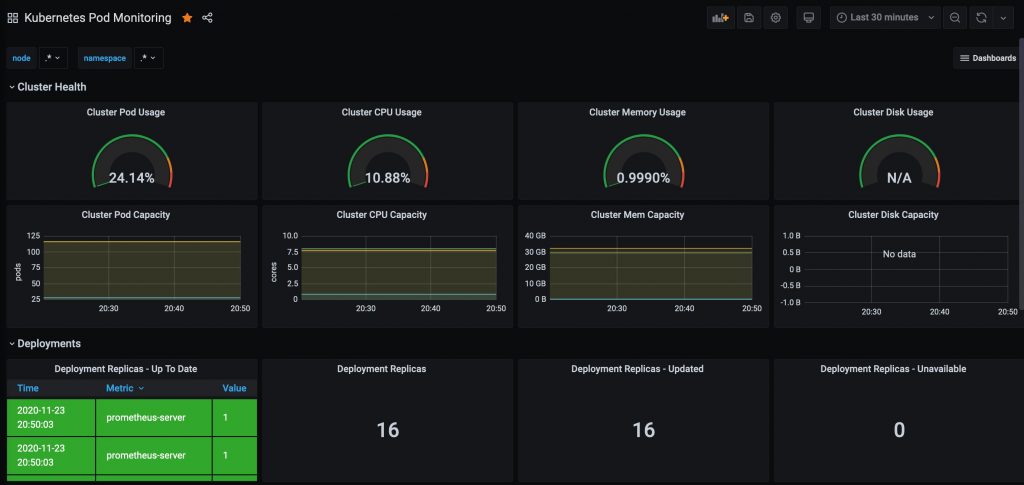
You’re now ready to query metrics data for the Prometheus Counter http_requests_total stored in the managed service workspace and visualize the rate of HTTP requests over a trailing 5-minute period using a Prometheus query as follows:
sum(rate(http_requests_total{exported_job=”recommender”}[5m])) by (path)
The figure below illustrates how to visualize this metric in Grafana across the different path labels captured in the Prometheus Counter.
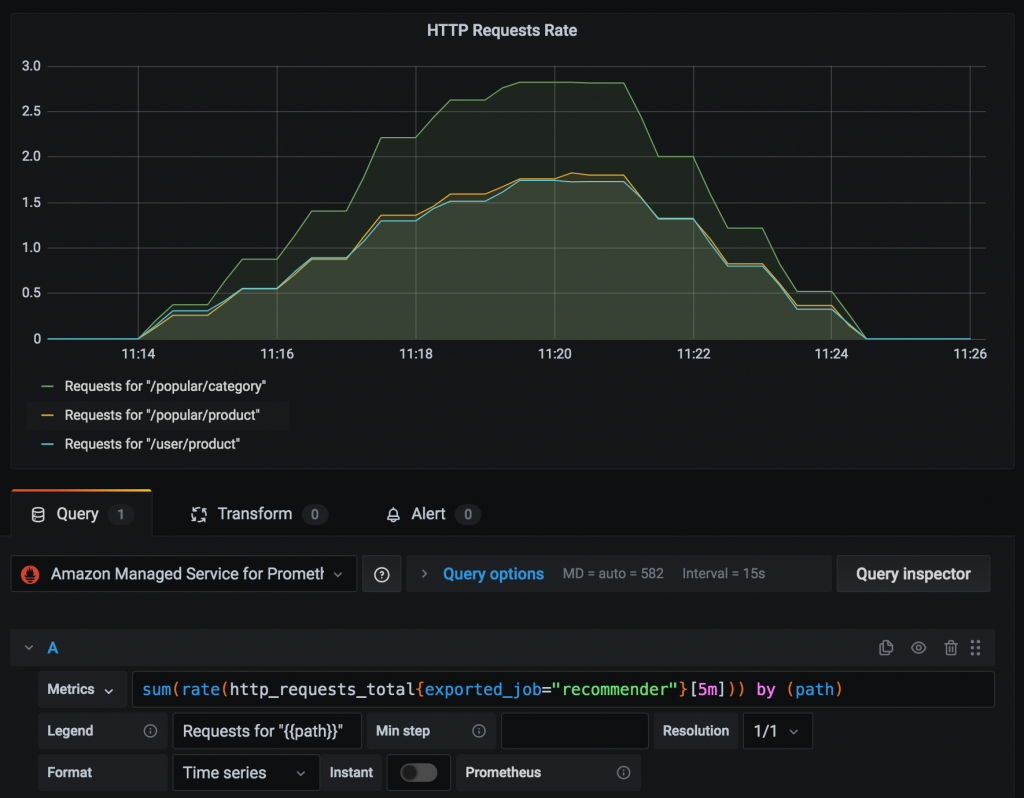
PromQL and metric visualization
In addition to service metrics collected from application workloads, we can also query system metrics captured by Prometheus for all the containers and nodes in a Kubernetes cluster. For example, the Prometheus Counter node_network_transmit_bytes_total captures the amount of data transmitted from each node of a cluster. The figure below visualizes the rate of data transfer from each node using a Prometheus query as follows: sum(rate(node_network_transmit_bytes_total[5m])) by (instance)
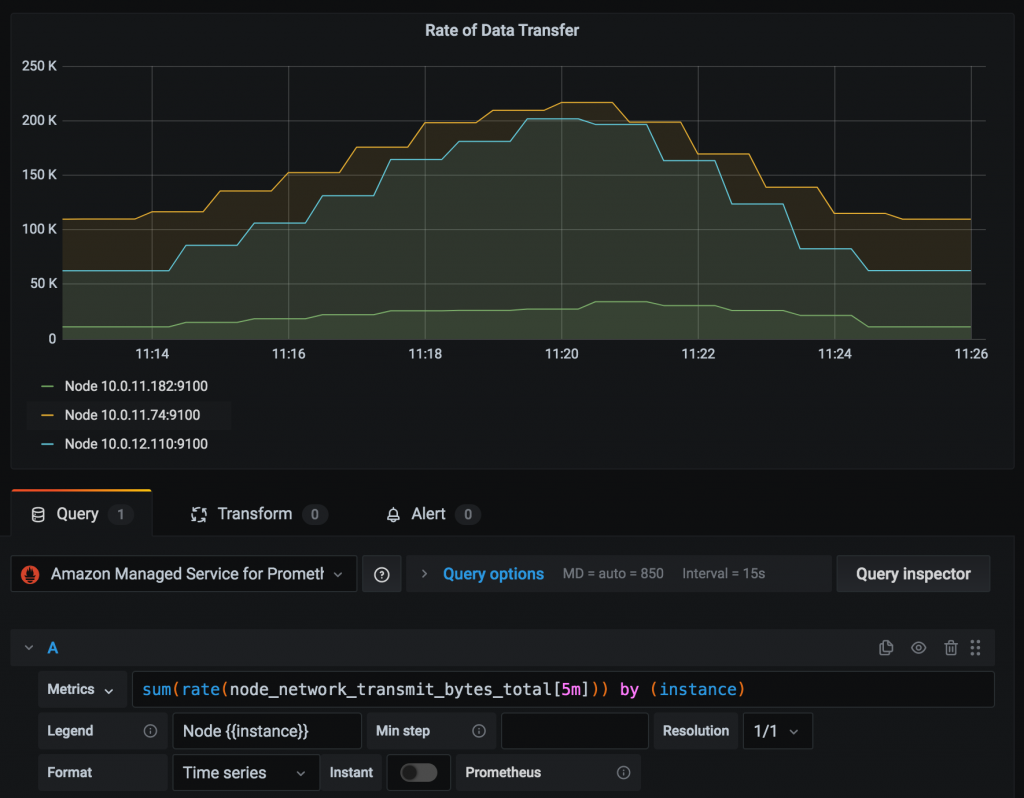
PromQL and metric data visualization
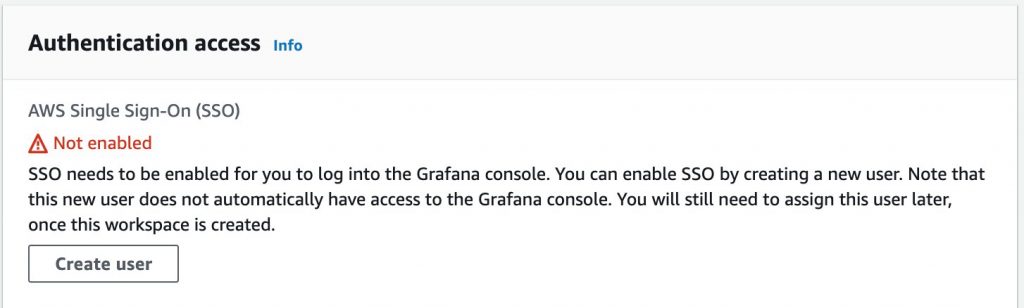
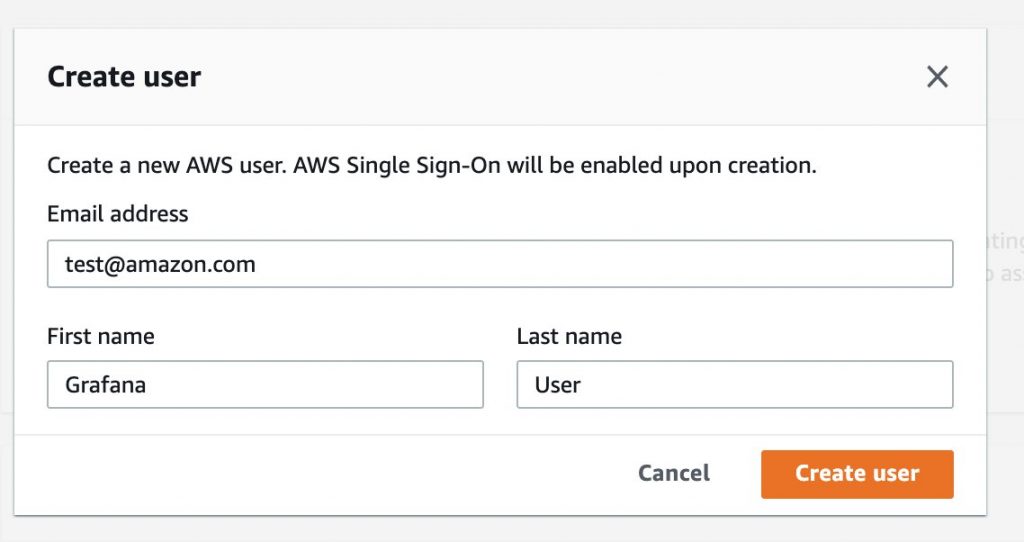
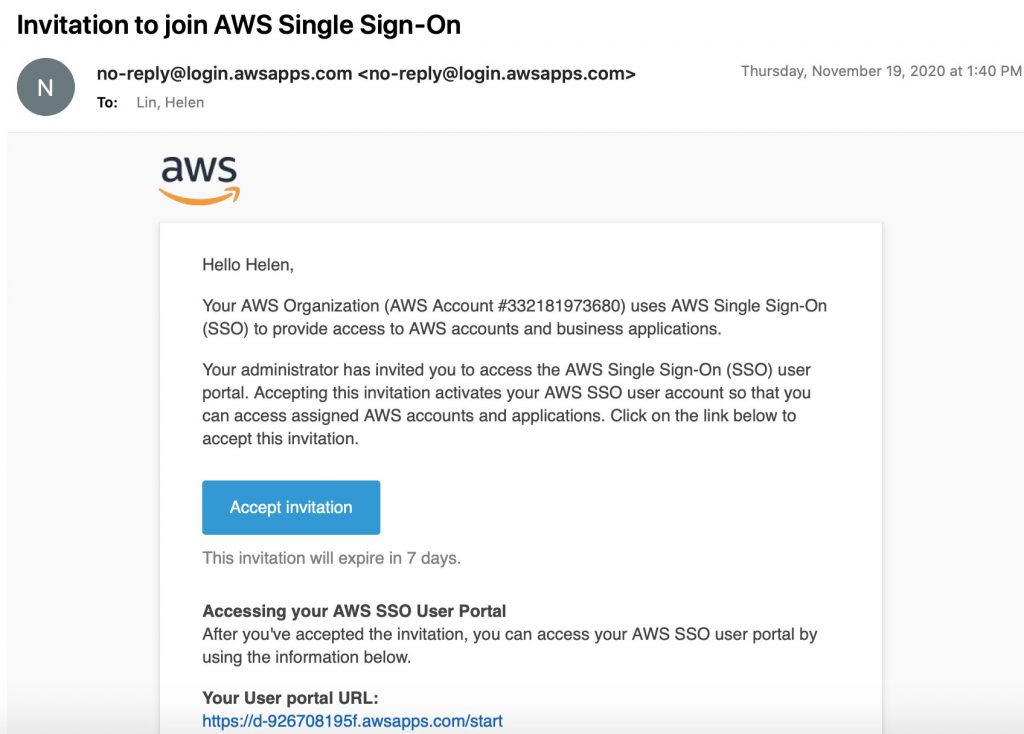
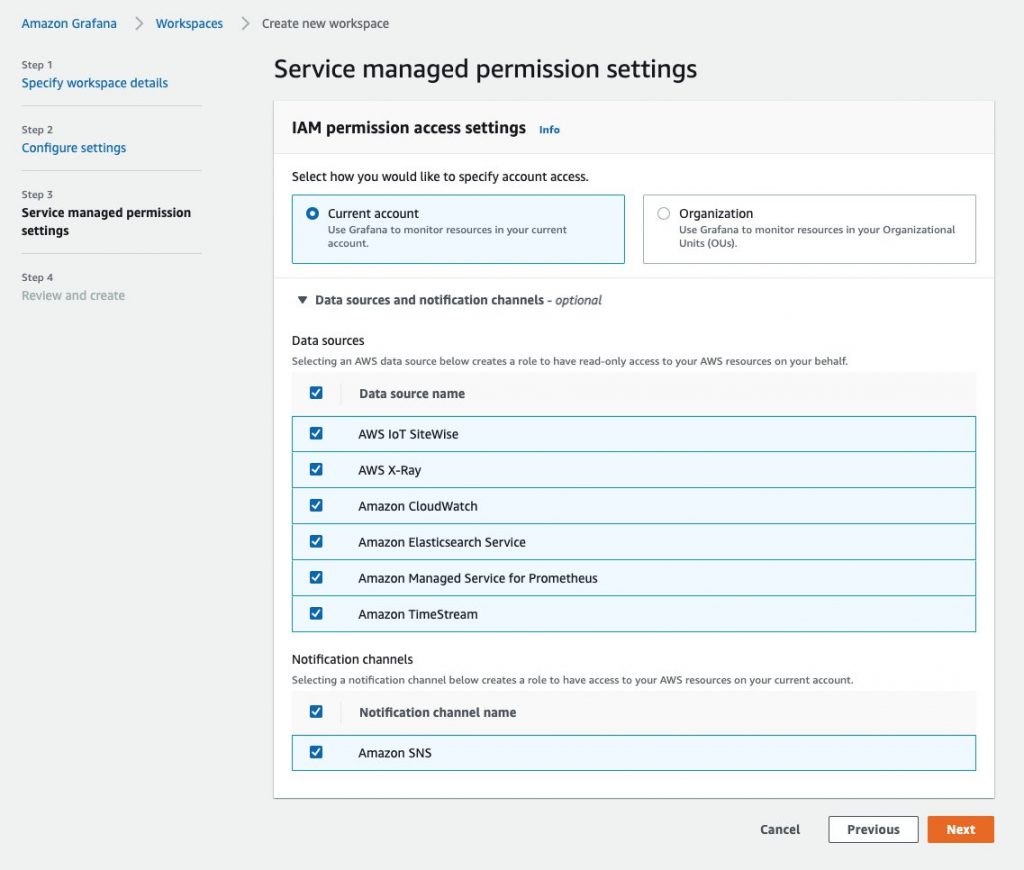
Users may also visualize these metrics using Amazon Managed Service for Grafana (AMG) as outlined in this blog post.
Concluding remarks
Prometheus is an extremely popular open source monitoring tool that provides powerful querying features and has wide support for a variety of workloads.This blog post outlined the steps involved in using Amazon Managed Service for Prometheus to securely ingest, store, and query Prometheus metrics that were collected from application workloads deployed to an Amazon EKS cluster. Amazon Managed Service for Prometheus can also be used in conjunction with any Prometheus-compatible monitoring and alerting service to collect metrics from other container environments such as Amazon ECS, self-managed Kubernetes on AWS, or on-premise infrastructure. Workspaces within Amazon Managed Service for Prometheus serve as a valid data source for Grafana. Therefore, users can visualize these metrics using a self-managed installation of Grafana or use Amazon Managed Service for Grafana.
Authors
 Viji Sarathy is a Senior Solutions Architect at Amazon Web Services. He has 20+ years of experience in building large-scale, distributed software systems in a broad range of verticals, both traditional and cloud native software stacks. His current interests are in the area of Container Services and Machine Learning. He has an educational background in Aerospace Engineering, earning his Ph.D from the University of Texas at Austin, specializing in Computational Mechanics. He is an avid runner and cyclist.
 Imaya Kumar Jagannathan is a Senior Solution Architect focused on Amazon CloudWatch and AWS X-Ray. He is passionate about Monitoring and Observability and has a strong application development and architecture background. He likes working on distributed systems and is excited to talk about microservice architecture design. He loves programming on C#, working with Containers and Serverless technologies.


 Michael Hausenblas


 Whenever you open multiple tabs on your Chrome browser, the tabs start narrowing and […]


